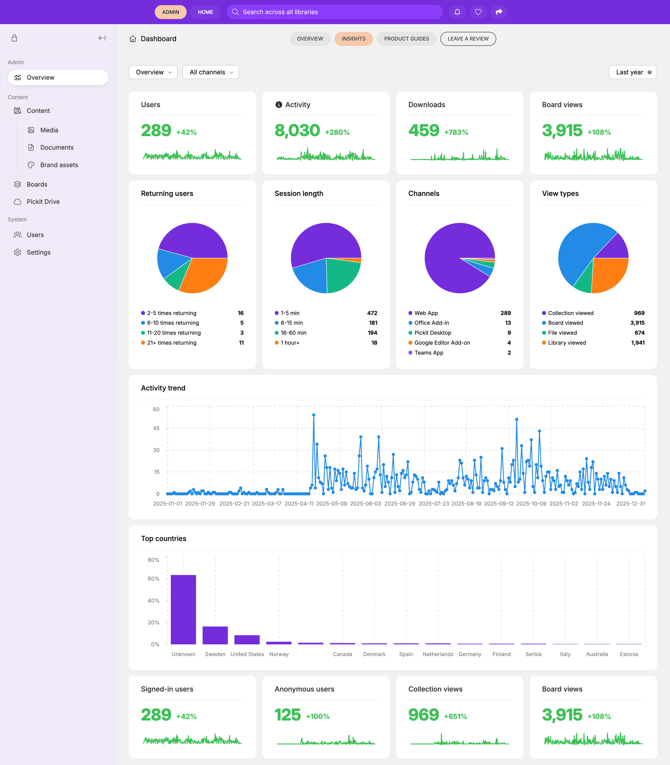
Where can I find Insights?
- Go to app.pickit.com and log in to your Pickit account.
- Switch to Admin Mode.
- Go to Overview in the left-hand menu.
- Select the Insights tab at the top of the page.
From here, you can select the time period you want to analyze and filter the statistics by channel and get top lists of assets, Boards, Collections and User stats.
What can I see in Insights?
The Insights dashboard gives you an overview of activity across your Pickit account, including:
- Users – See how many users have been active in Pickit.
- Activity – See the overall amount of activity within your account.
- Downloads – See how often content has been downloaded.
- Board views – See how many times your Boards have been viewed.
- Returning users – Understand how frequently users return to Pickit.
- Session length – See how long users typically spend in Pickit.
- Channels – See where your users are accessing Pickit, such as the Web App, Office Add-in, Pickit Desktop, Google Add-on, or Teams App.
- View types – See how users interact with different types of content, including Collections, Boards, files, and libraries.
- Activity trend – Follow activity over time to identify changes and usage patterns.
- Top countries – See where your Pickit usage is coming from geographically.
- Signed-in and anonymous users – Compare activity from signed-in users with anonymous access.
- Collection and Board views – See how frequently your Collections and Boards are being viewed.
You can use these statistics to get a better understanding of how Pickit is being adopted and how your content is being used, and identify areas where you may want to improve or promote content further.